As we gear up for the launch of our Telegram Channel, let’s dive into the basics of Forex chart analysis. Today, we’re focusing on trend lines, which are like roadmaps showing where prices are heading.
Trend lines are drawn by connecting the lows or highs of price movements. In an uptrend, they connect rising lows, while in a downtrend, they connect falling highs. These lines help us see the overall direction of the market.
But remember, trends can change suddenly, so it’s important to confirm them with other indicators. Trend lines also act as support or resistance levels, guiding us on when to buy or sell.
By understanding trend lines, traders can make better decisions and navigate the Forex market more confidently.
What Is an Uptrend Line?
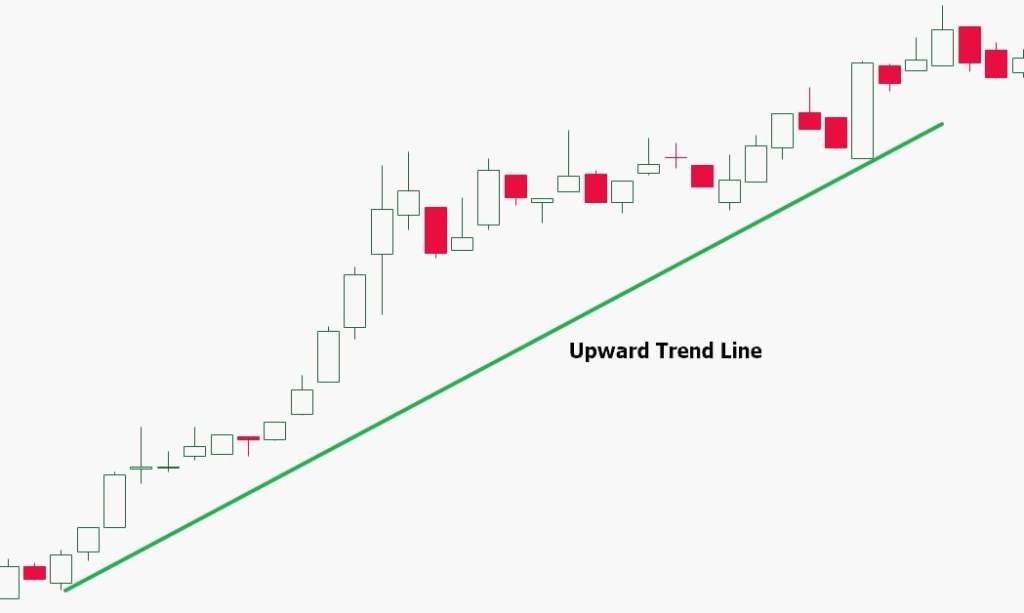
An upward trend line is like a ladder going up, showing that prices are generally increasing over time. It’s like climbing steps where each one is a bit higher than the last. For traders, this is a good sign to buy because they expect prices to keep going up. It’s like being on an escalator that’s moving in the upward direction.
What Is a Downtrend Line?
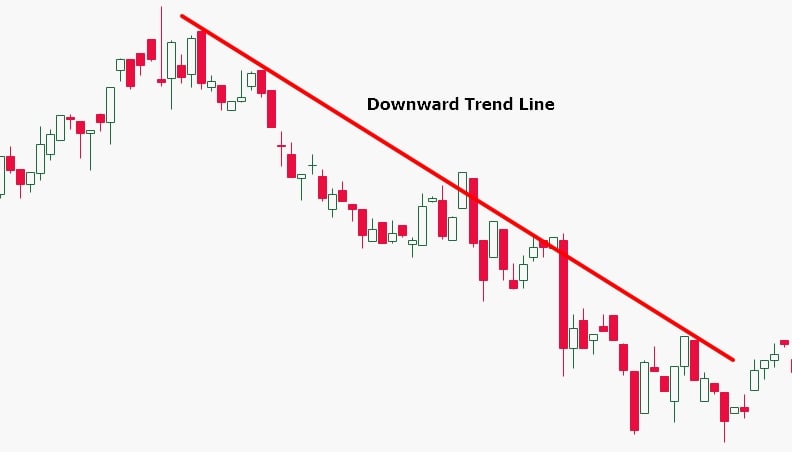
A downward trend line is like walking down a hill, showing that prices are generally decreasing over time. It’s like stepping down stairs where each step is lower than the previous one. For traders, this might signal a good time to sell because they expect prices to keep dropping.
What Is a Sideways Trend?
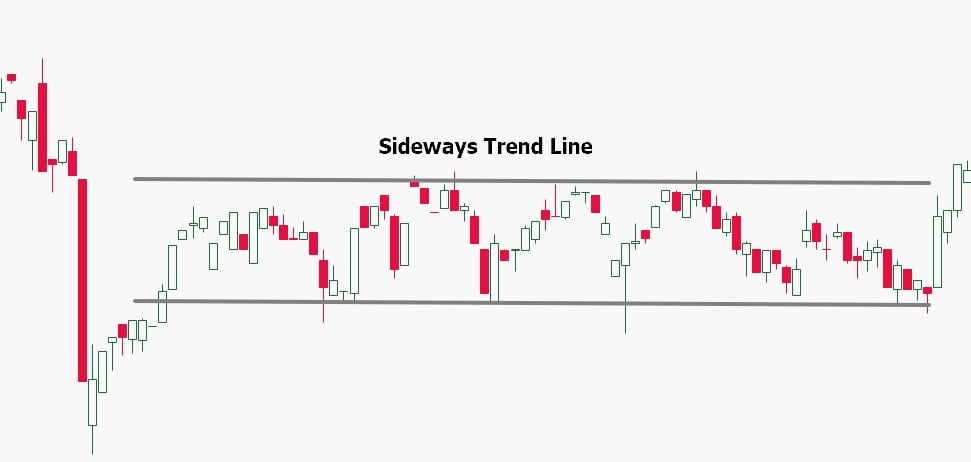
A sideways trend in the market occurs when prices largely fluctuate within a defined range, showing neither significant upward nor downward movement. It resembles a flat road, where prices remain relatively stable, lacking a clear direction towards either ascent or descent.
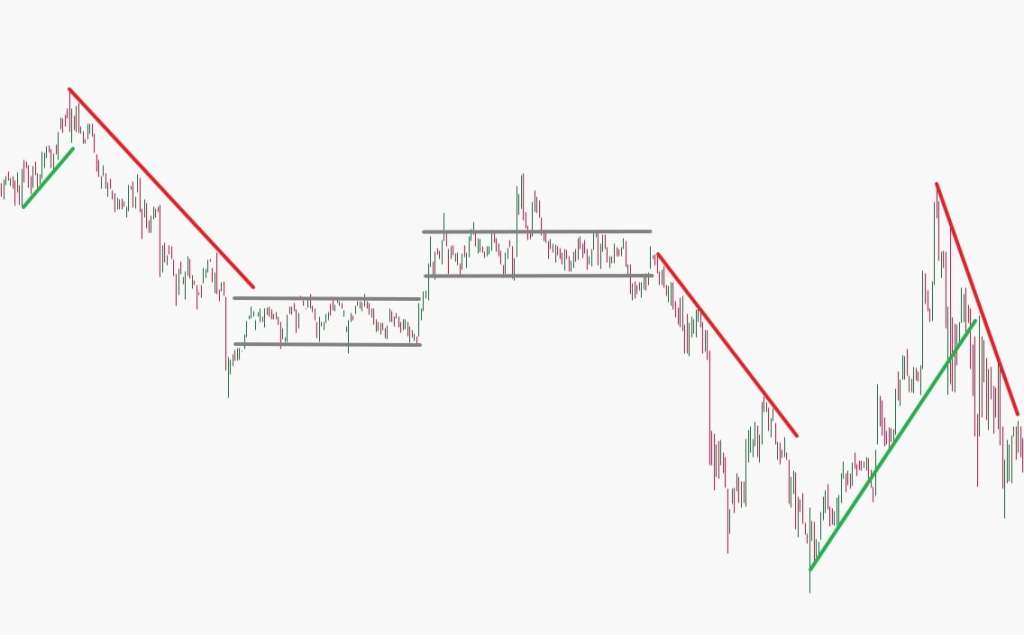
Trend lines are fundamental in spotting bull and bear runs. These lines, drawn on charts, help gauge the strength and direction of trends by connecting low or high points in price action. They serve to smoothen out market fluctuations, providing a clear indication of ongoing trends. An upward trend is recognized by higher highs and lows over time, while a downward trend is characterized by lower highs and lows. For confirmation, trend lines typically require connections between at least three significant points.
In conclusion, trendlines are helpful for traders who want to make sure they’re on the right side of a market trend. They can show where the price might find support or resistance, which helps traders decide if the trend will keep going. Any trader can learn to draw a basic trendline and use it in their trading strategy. While there might be different opinions on where to start the trendline, most traders agree that it becomes stronger when more prices confirm the support or resistance levels.
by Vanessa Vasilache


Leave a comment